Customer needs
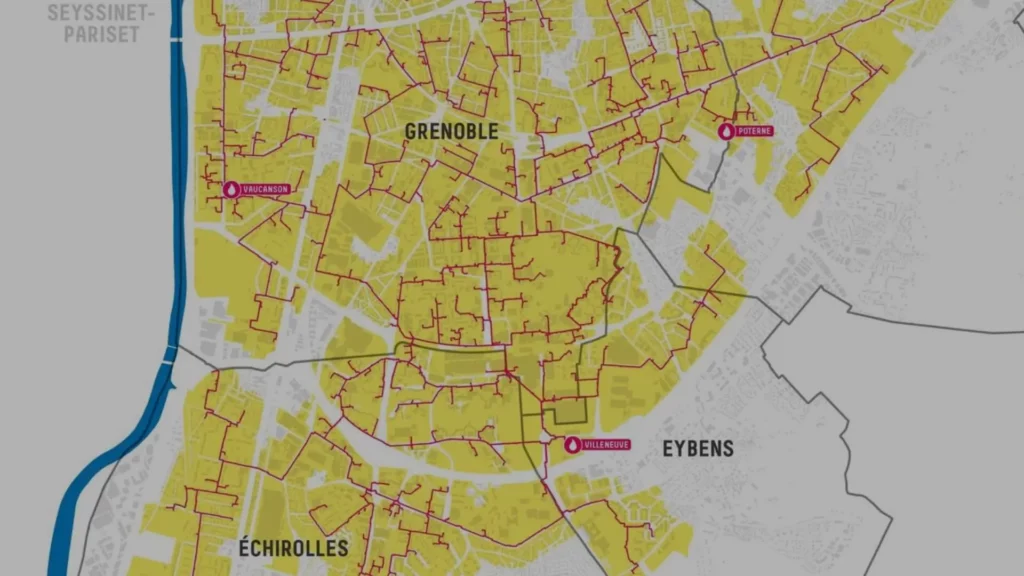
As a public operator, the Intercommunal Heating Company of the Grenoble Urban Area (CCIAG) manages the district heating network of Grenoble-Alpes Metropolis. This extensive district network spans more than 180 kilometers and ranks as the second largest in France. It supplies heating and domestic hot water to public and private buildings, including residential complexes and offices. In total, it provides heat equivalent to 100,000 houses, with average annual energy sales of 800 GWh. CCIAG operates 5 production sites and relies on 10 different fuel types.
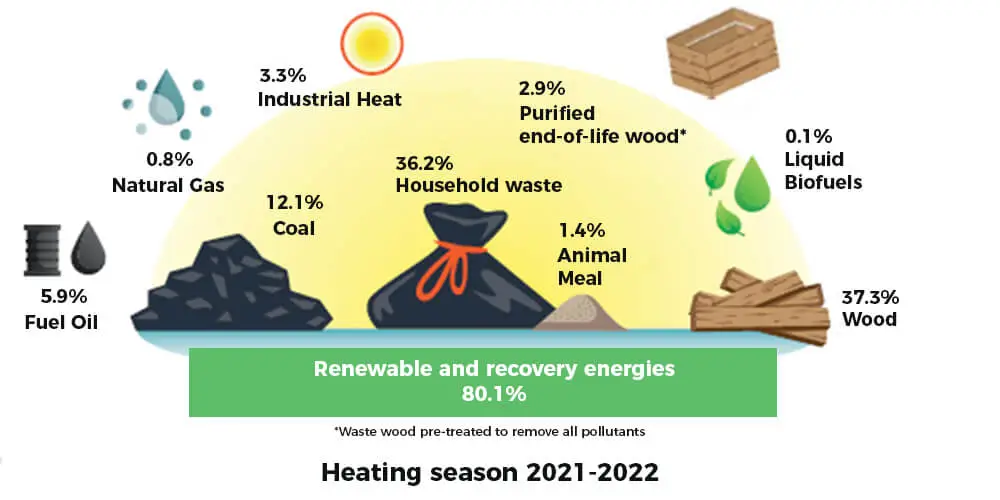
CCIAG chooses its fuels with the goal of controlling energy consumption and reducing greenhouse gas emissions and air pollution. The company is actively working to gradually reduce the use of coal, which still represented 12% of the energy mix in 2022. Each production site has its own specific constraints, but CCIAG plans to eliminate coal completely by 2026.
Energy mix and operational choices
The types and proportions of each fuel are chosen based on technical, economic, and environmental criteria. CCIAG adjusts these decisions regularly, especially during major fuel price variations. Thermal storage is used to provide flexibility, helps regulate production, and reduces the use of backup boilers.
Importance of accurate temperature forecasts
To adjust its energy production and define the optimal utilization of its production resources, CCIAG needs to anticipate heat requirements. Outdoor temperature directly influences heat demand, so accurate temperature forecasts are essential. The company targets an average error of less than 1.2°C during the winter season, while conventional systems typically offer an accuracy of around 2°C. FROGCAST provides CCIAG with temperature forecasts four times a day, up to fourteen days ahead.
Description of the forecasting solution
A complex geographical environment
Grenoble’s unique bowl-shaped topography makes temperature forecasting difficult. Meteorological models show systematic and situation-specific biases. For example, temperature inversions are common: cold air becomes trapped in the valley bottom while warmer air sits above. These inversions often occur in anticyclonic conditions with persistent low-level clouds, which many models struggle to represent.
Raw meteorological model outputs do not meet CCIAG’s accuracy requirements. For most models, mean absolute errors (MAE1) exceeded 2°C during the first 24 hours of the forecast (winter 2019–2022). Steadysun created a customized solution to reduce these errors, focusing on lowering the seasonal average error and decreasing the occurrence of very large errors, especially those above 2°C.
Multimodel forecasting
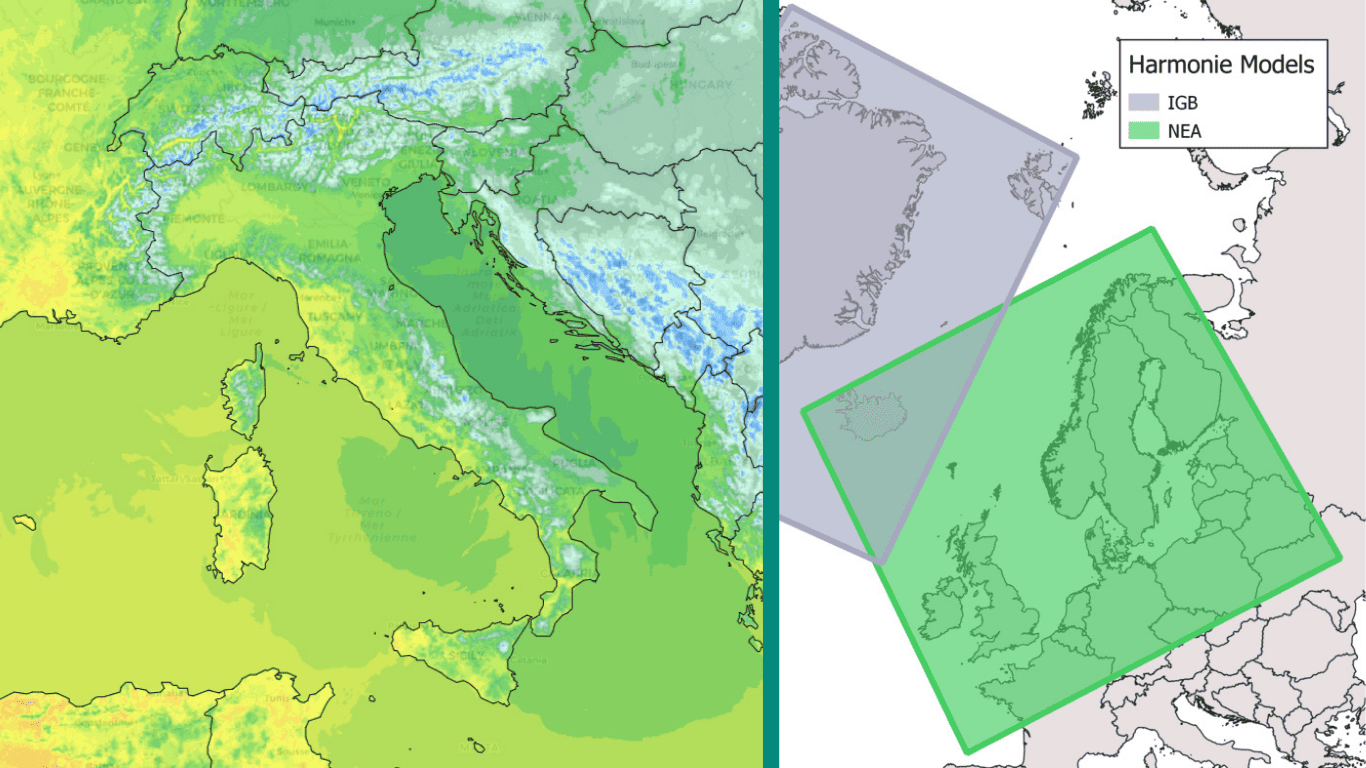
The FROGCAST platform uses forecasts from the world’s leading numerical weather models:
- Météo-France (AROME, ARPEGE),
- German DWD (ICON-D2, ICON-EU),
- U.S. National Oceanic and Atmospheric Administration – NOAA (GFS, GEFS),
- European Centre for Medium-Range Weather Forecasts – ECMWF (IFS-HRES),
- and the Canadian Meteorological Service (GDPS).
These information sources are optimally combined on each grid point of the globe. This multimodel approach reduces large errors by giving more weight to the most consistent meteorological scenario, the one shared by the majority of models.
Post-Processing and correction by analogy
CCIAG uses a temperature sensor near its Poterne production site. These local measurements are an essential source of information, as they allow the assessment of forecast quality over an extended period and the development of advanced post-processing tools.
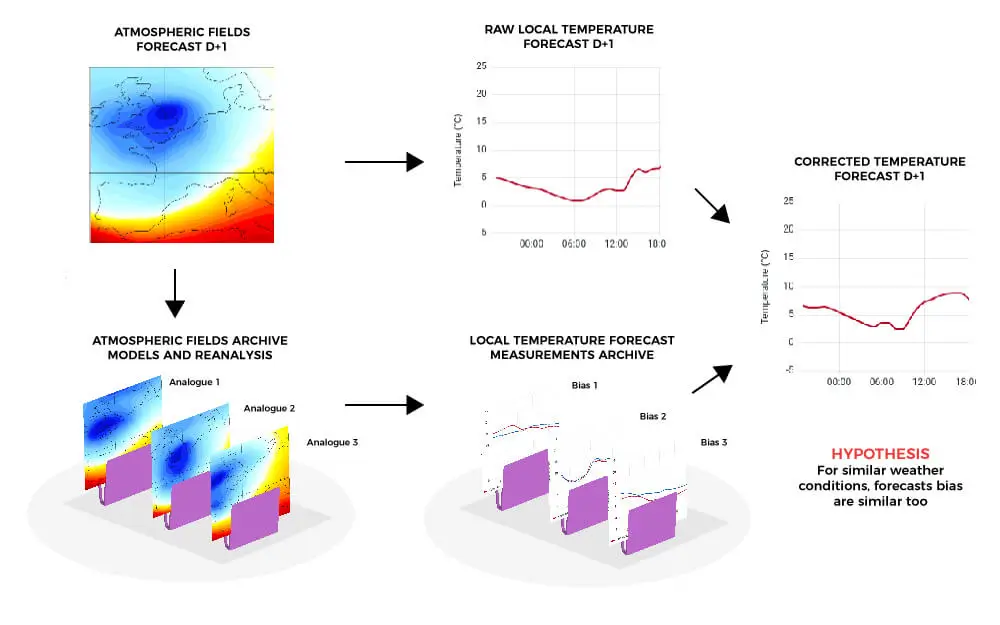
The chosen method is based on the principle of analogy (Figure 2). It requires access to meteorological forecast archives and atmospheric reanalyses at a continental scale for certain parameters (geopotential, temperature, relative humidity, etc.), along with local forecasts for the variable being corrected. For each new forecast, the meteorological situation is analyzed and described using large-scale weather fields called predictors. Days with similar weather patterns are selected. The method then relies on the assumption that for similar meteorological conditions, models will have similar biases. This allows the anticipation of errors in the current forecast and correct them.
This post-processing method offers 2 major benefits:
- it adapts to the meteorological situation
- it improves over the years as the depth of archives increases.
Results
Forecast accuracy improvement
The FROGCAST multi-model forecast, coupled with the analogy-based post-processing method, has been operational at the District Heating Company since the winter of 2021-2022. Moreover, meteorological archives have extended the method’s evaluation over two additional winters.
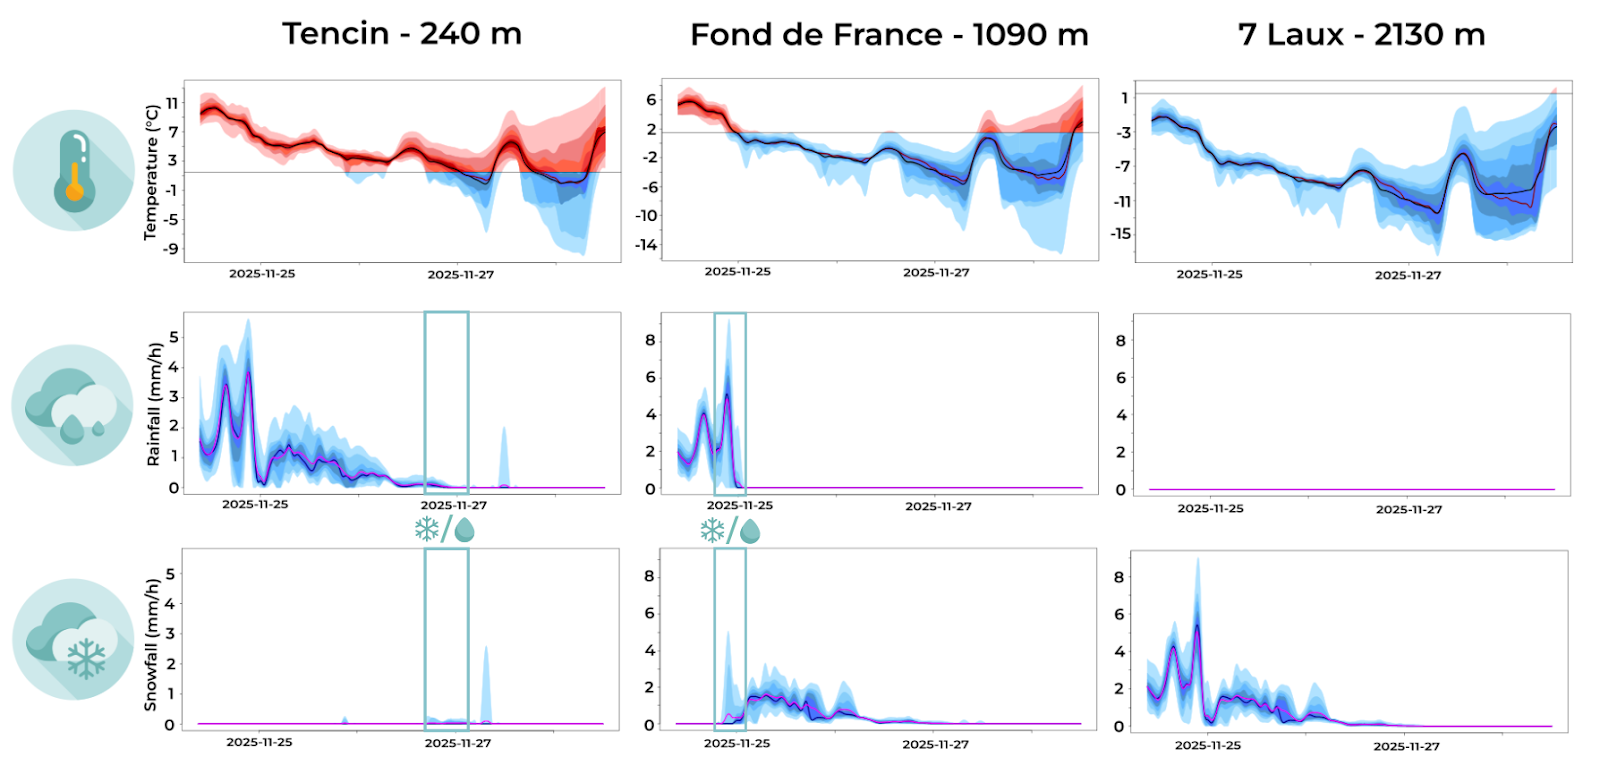
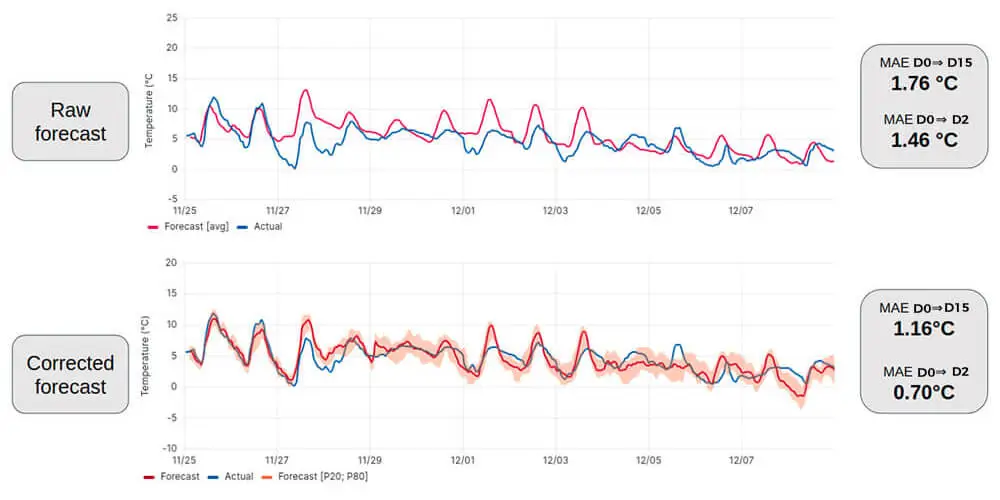
Figure 3 shows a 15-day forecast example provided to CCIAG. The top curve represents the raw FROGCAST forecast, and the bottom curve shows the corrected version using the analogy-based post-processing. The P20-P80 confidence interval is constructed using the various corrections provided by individual analogous days. It is noteworthy that the multi-model raw forecast relatively simulates the temperature in Grenoble well, with a MAE of 1.46°C for the first three days of the forecast. However, some days show large errors, such as November 27 (> 3°C).The application of the analogy-based correction significantly improves the forecast by reducing these errors. We achieve a reduction of approximately 0.74°C in MAE between Day+0 and Day+3 and a reduction of 0.6°C for a Day+15 forecast, resulting in improvements of 51% and 34%, respectively.
Long-term performance
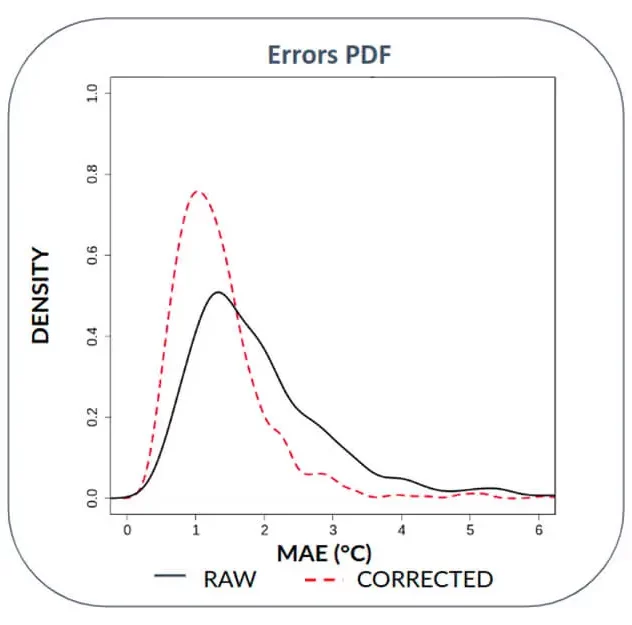
Performance improvement has been quantitatively assessed over four winters since 2019. Errors (MAE) in the first 24 hours of forecasts are presented in Figure 4 in the form of a probability density function. The application of the analogy-based post-processing not only reduces the mean error from 2.1°C to 1.2°C but also reduces the occurrence of very large errors (> 3°C), from 10% to less than 3%. These very significant errors, particularly problematic for urban heating network management, have thus been substantially reduced, meeting CCIAG’s expectations regarding maximum mean errors.
Perspectives
Continuous improvement
As previously mentioned, one advantage of the analogy-based method is its automatic enrichment over time with the increase in available meteorological archive depth. Therefore, we can expect a constant improvement in forecast quality as the years go by.
Integration of new data sources
Other sources of meteorological data can also be integrated into the current forecasting system. One such source is the immediate forecast product from the AROME model, with data updated every 3 hours, providing refined forecasts for the next 6 hours. The assimilation of a large number of observational data in this system (ground-based stations, radar, etc.) significantly reduces biases and could bring significant improvements to the performance in the very short-term forecasts.
Potential for sensor network deployment
The deployment of a sensor network around the Grenoble basin, both in the valley and at higher altitudes, could refine forecasting and develop additional tools. Local phenomena, such as passing showers or the onset of the south wind (foehn), involve sudden temperature variations of up to ten degrees in a few minutes. An alert system based on measurements taken a few kilometers from Grenoble could provide a precise forecast of the timing of these rapid fluctuations minutes in advance.
- The normalized Mean Absolute Error (nMAE) is calculated using half-hour intervals. This is consistent with the usual functioning of the electricity network. To quantify the forecasts or the daily production, we consequently have a set of 48 values corresponding to 48 time slots of 30 minutes each (e.g., the 1rst value is the average power between 00.00 am and 00.30 am, the 2nd value between 00.30 am and 01.00 am, and so forth).
Powers are normalized by the peak power in order to allow comparisons between a power plant and another one.
A daily nMAE value is then calculated as the average of the 48 half-hour errors for each day and for each year:
Where and are the average power planned and actual power during the 30-minute time slot, is the peak power, and “48” represents the number of half-hour slots per day.
Finally, the overall forecast system accuracy for a power plant is estimated by averaging the daily nMAE values over all available days:
↩︎