EN
ENAt FROGCAST, our weather forecasts leverage cutting-edge technology to deliver a wide range of atmospheric parameters, global coverage, optimal accuracy, and dependable service. Designed today to anticipate tomorrow, FROGCAST empowers you to make informed decisions by covering all your weather-related needs.
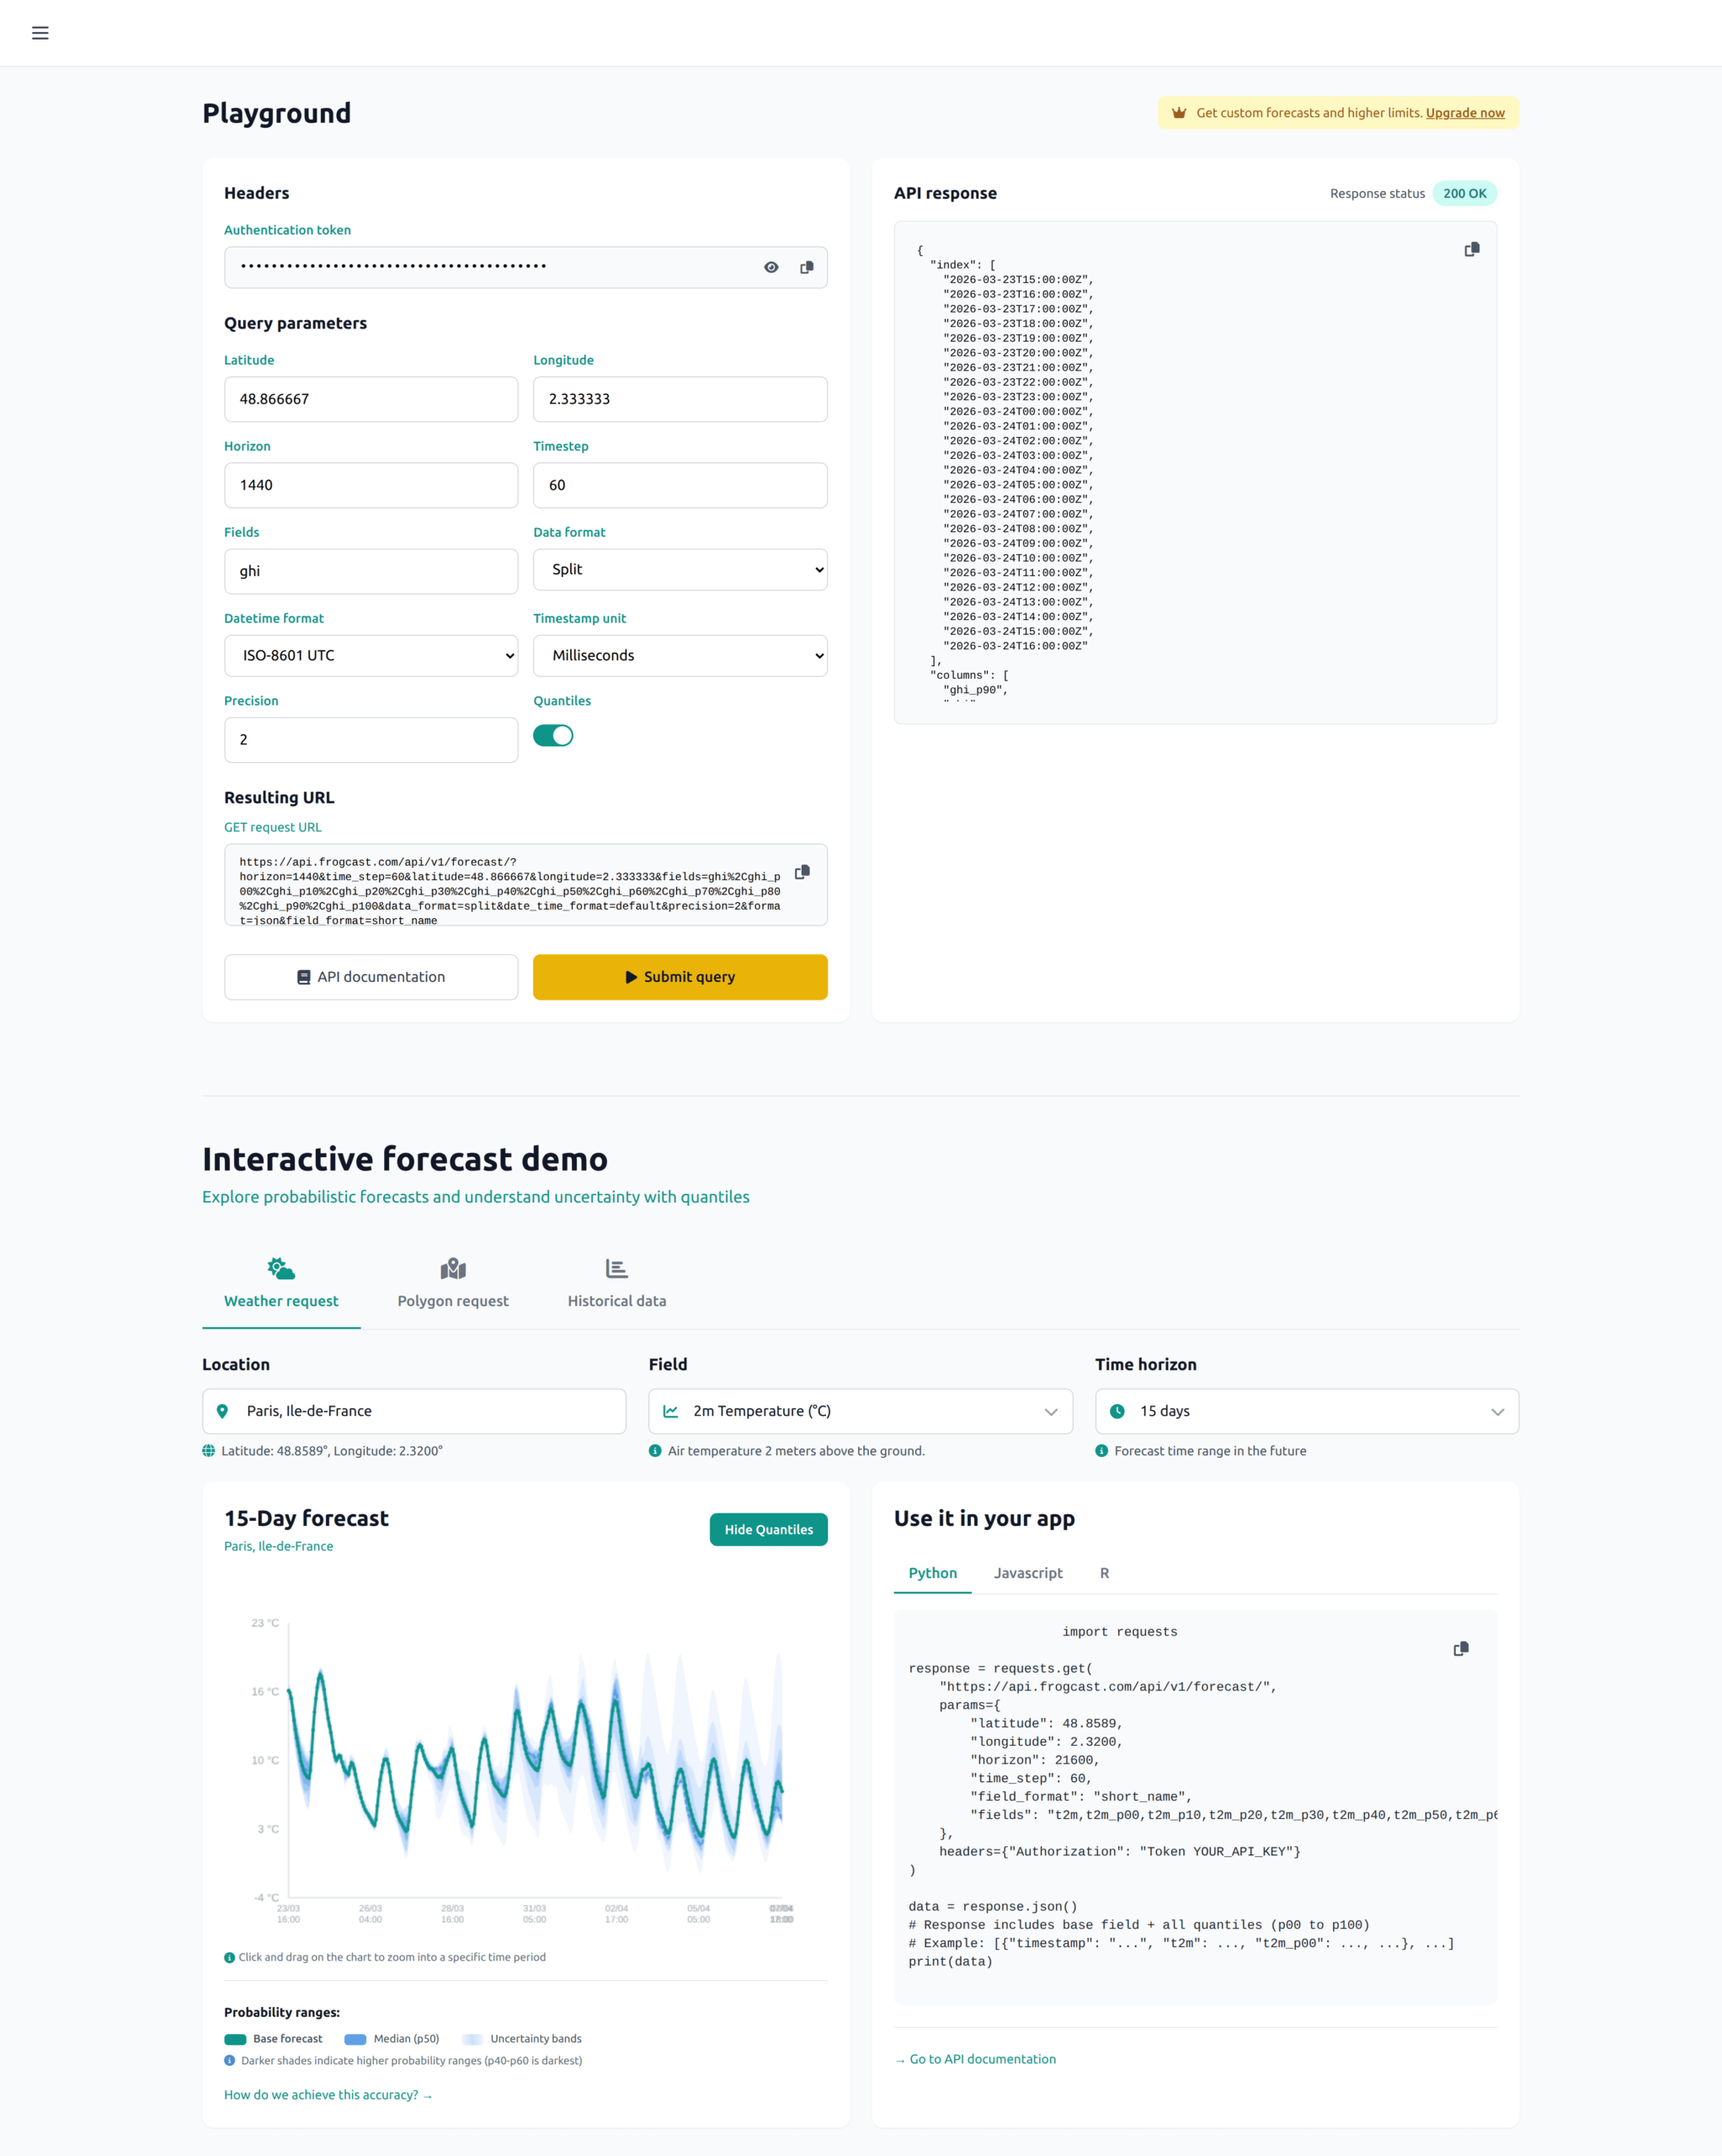
Access hourly and daily weather forecasts up to 15 days ahead through a one simple API request. Query a single location or entire regions for apps, dashboards, or data workflows.
Pass latitude and longitude to get weather forecasts for a specific location.
Get precise forecasts for a specific location (a farm, a building site, a sensor).
Test the API instantly with lat/lon coordinates and start building your integration.
Hourly data for one location, ideal for operational alerts and scheduling.
					import requests

response = requests.get(
    "https://api.frogcast.com/api/v1/forecast/",
    params={
        "latitude": 50.3494,
        "longitude": -4.7051,
        "horizon": 21600,
        "time_step": 60,
        "field_format": "short_name",
        "fields": "t2m,t2m_p00,t2m_p10,t2m_p20,t2m_p30,t2m_p40,t2m_p50,t2m_p60,t2m_p70,t2m_p80,t2m_p90,t2m_p100"
    },
    headers={"Authorization": "Token YOUR_API_KEY"}
)

data = response.json()
# Response includes base field + all quantiles (p00 to p100)
# Example: [{"timestamp": "...", "t2m": ..., "t2m_p00": ..., ...}, ...]
print(data)
					const response = await fetch(
    'https://api.frogcast.com/api/v1/forecast/?' +
    new URLSearchParams({
        latitude: 50.3494,
        longitude: -4.7051,
        horizon: 21600,
        time_step: 60,
        field_format: 'short_name',
        fields: 't2m,t2m_p00,t2m_p10,t2m_p20,t2m_p30,t2m_p40,t2m_p50,t2m_p60,t2m_p70,t2m_p80,t2m_p90,t2m_p100'
    }),
    {
        headers: { 'Authorization': 'Token YOUR_API_KEY' }
    }
);

const data = await response.json();
// Response includes base field + all quantiles (p00 to p100)
// Example: [{"timestamp": "...", "t2m": ..., "t2m_p00": ..., ...}, ...]
console.log(data);
					library(httr)
library(jsonlite)

response <- GET(
    "https://api.frogcast.com/api/v1/forecast/",
    query = list(
        latitude = 50.3494,
        longitude = -4.7051,
        horizon = 21600,
        time_step = 60,
        field_format = "short_name",
        fields = "t2m,t2m_p00,t2m_p10,t2m_p20,t2m_p30,t2m_p40,t2m_p50,t2m_p60,t2m_p70,t2m_p80,t2m_p90,t2m_p100"
    ),
    add_headers(Authorization = "Token YOUR_API_KEY")
)

data <- fromJSON(content(response, "text"))
# Response includes base field + all quantiles (p00 to p100)
# Example: [{"timestamp": "...", "t2m": ..., "t2m_p00": ..., ...}, ...]
print(data)
Define a geographic area with coordinates, the API aggregates weather data across the entire region.
Evaluate weather impacts over an entire area, not just a single point.
Aggregate forecasts across multiple sites, solar farms, or infrastructure zones.
Align weather data with real-world operational zones for better planning.
					import requests

# Define polygon coordinates
polygon_coords = "49.24,2.5,49,3,48.8,2.9,48.5,2.5,48.6,2,49,1.7"  # lat1,lon1,lat2,lon2,...

response = requests.get(
    "https://api.frogcast.com/api/v1/forecast_polygon/",
    params={
        "polygon": polygon_coords,
        "time_step": 60,
        "horizon": 21600,
        "fields": "10m_gust",
        "data_format": "records",
        "field_format": "short_name",
        "compute_mode": "stats"
    },
    headers={"Authorization": "Token YOUR_API_KEY"}
)

data = response.json()
print(data)
					// Define polygon coordinates
const polygonCoords = "49.24,2.5,49,3,48.8,2.9,48.5,2.5,48.6,2,49,1.7";  // lat1,lon1,lat2,lon2,...

const url = new URL('https://api.frogcast.com/api/v1/forecast_polygon/');
url.searchParams.set('polygon', polygonCoords);
url.searchParams.set('time_step', '60');
url.searchParams.set('horizon', '21600');
url.searchParams.set('fields', '10m_gust');
url.searchParams.set('data_format', 'records');
url.searchParams.set('field_format', 'short_name');
url.searchParams.set('compute_mode', 'stats');

const response = await fetch(url.toString(), {
    headers: { 'Authorization': 'Token YOUR_API_KEY' }
});

const data = await response.json();
console.log(data);
					library(httr)
library(jsonlite)

# Define polygon coordinates
polygon_coords <- "49.24,2.5,49,3,48.8,2.9,48.5,2.5,48.6,2,49,1.7"  # lat1,lon1,lat2,lon2,...

response <- GET(
    "https://api.frogcast.com/api/v1/forecast_polygon/",
    query = list(
        polygon = polygon_coords,
        time_step = 60,
        horizon = 21600,
        fields = "10m_gust",
        data_format = "records",
        field_format = "short_name",
        compute_mode = "stats"
    ),
    add_headers(Authorization = "Token YOUR_API_KEY")
)

data <- fromJSON(content(response, "text"))
print(data)
Our weather API integrates seamlessly with your existing systems. Use the Playground to automatically generate your queries, then copy and paste the generated code (or URL) directly into your applications for immediate access to the weather data you need.
Sub-100ms responses with 99.7% uptime SLA
Simple integration, works with any language
Get 400 free API requests when creating your account
We combine the world’s best weather models with on-site data. Our engineers and meteorologists actively monitor model performance, validate outputs, and intervene where automation alone falls short, working alongside machine learning.
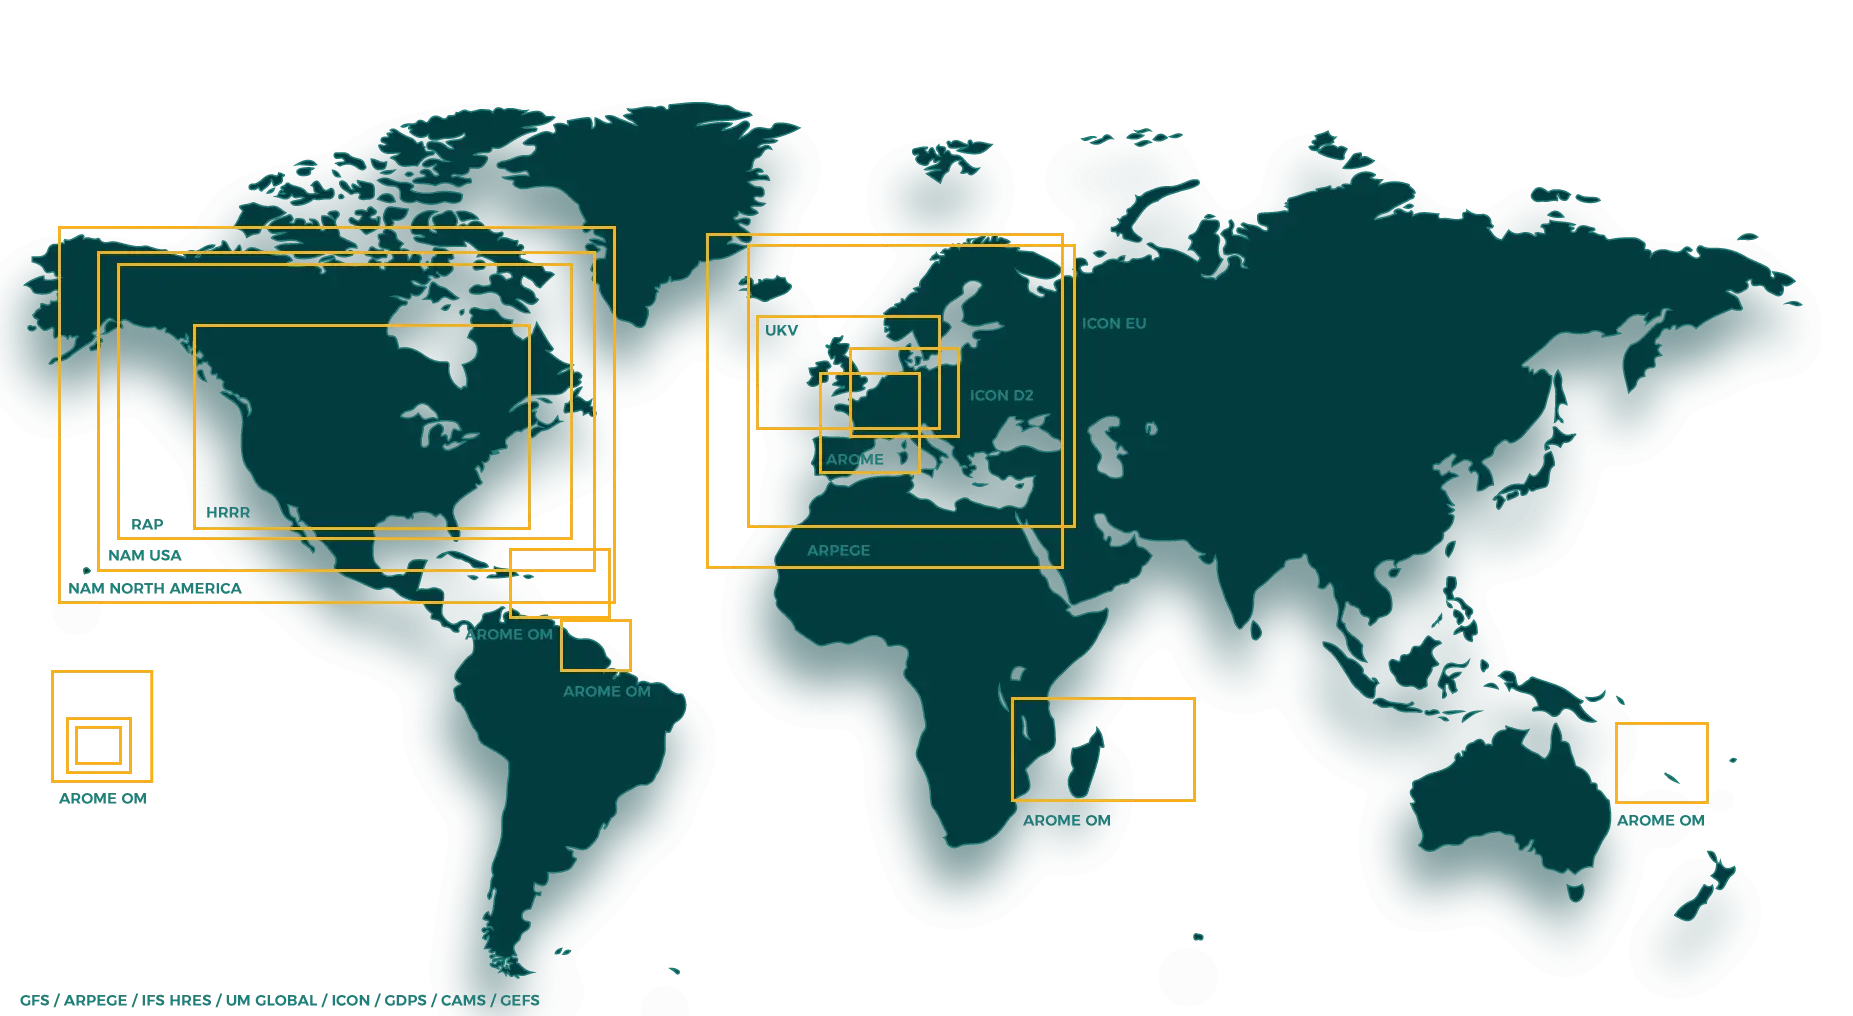
FROGCAST aggregates a wide array of geospatial data from over 25 Numerical Weather Prediction (NWP) models provided by national meteorological agencies worldwide, each capturing different regional dynamics and temporal resolutions.
All models are carefully pre-processed and rigorously weighted according to their specificities and their real-world performance at each location. When one model underperforms in a specific region or season, its influence is automatically reduced.
This multi-model approach allows us to compensate for the individual meteorological agencies errors and produces a measurably better forecast.
Our machine learning algorithms continuously update the weighting between models at any point on the globe to track their evolution and ensure the best possible FROGCAST’s forecast.
We continuously collect and process in-situ measurements from various observation sites worldwide (such as temperature, precipitation, wind speed…), taken directly where weather phenomena occur.
These real-world measurements are continuously compared against each model’s output in real time. This evaluation allows us to determine, for each point on the globe and meteorological variable, which models perform best.
This drives the weighting. If a model consistently underestimates rainfall in a given region, that bias is captured and its influence adjusted accordingly. Ground truth continuously feeds the system, helping forecasts improve over time.

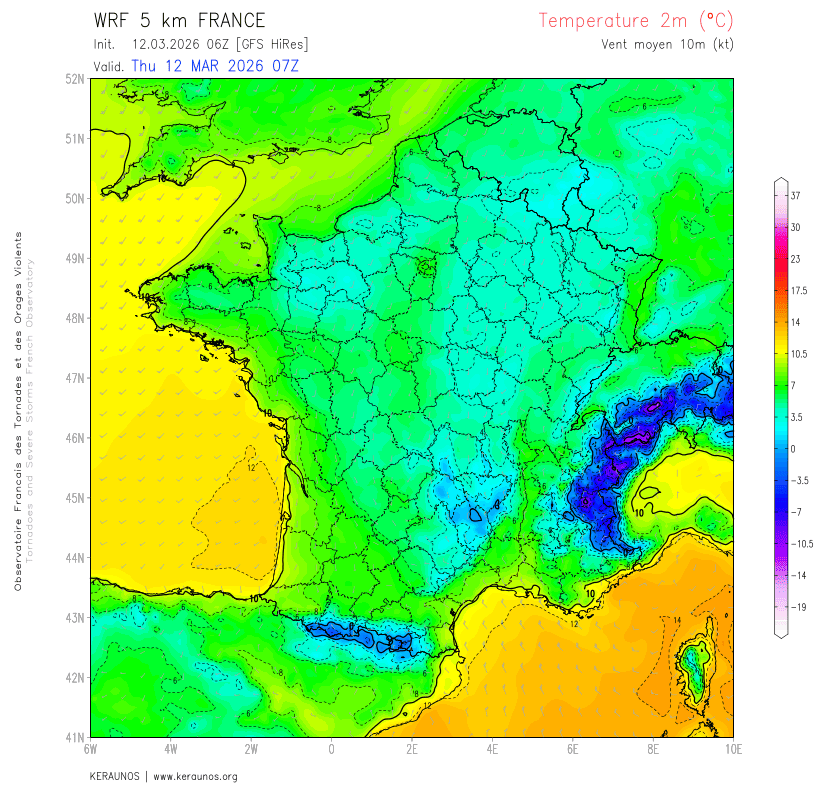
Global NWP models often lose precision in complex terrain such as coastal zones, mountain ranges, or dense urban areas. Where standard resolution falls short, we can deploy the high-resolution WRF (Weather Research and Forecasting) model for regional weather forecasting.
Running at resolutions down to 1 km, WRF captures small-scale atmospheric processes and local weather patterns that global models often miss, significantly improving forecast accuracy in challenging regions.
At FROGCAST, we’re pushing the boundaries of weather intelligence to deliver forecasts that redefine accuracy and relevance. Our unique combination of cutting-edge technology, advanced scientific methods, and proven expertise enables us to provide reliable, actionable, and tailored to the most demanding requirements.
Running 25+ models and ground-based observations simultaneously generates enormous volumes of meteorological data.
We’ve built the infrastructure to collect, store, access, process, and serve it. Our team, supported by machine learning technologies, harmonizes these extensive datasets to produce consistent and reliable forecasts.
In addition, we archive every forecast FROGCAST has ever produced. This historical record allows us to perform detailed evaluations and continuously improve the performance of our models.
Our machine learning algorithms do two things continuously :
Weights are updated daily, so the system gets smarter with every new forecast cycle.
Weather is inherently uncertain. That uncertainty carries real operational value when properly measured. Our probabilistic forecasts capture the full range of what the atmosphere might do, offering a more complete view of future conditions than any single prediction can. For every meteorological variable, we output 11 quantiles in addition to the mean forecast.
The level of dispersion between those quantiles reflects how much weather scenarios diverge and how confident the models are. By estimating the probability of each outcome, you make better-informed decisions and manage weather-related risks more effectively.
High-resolution weather data designed for professional applications. From global coverage to frequent updates and fine spatial resolution, FROGCAST delivers the reliability and granularity required for analytics, automation, and operational decision-making.
Up to 15 days
1 hour
Down to 1 km (WRF)
Up to 8×/day
Worldwide
25+ models & on-site data
FROGCAST provides a comprehensive range of meteorological weather parameters, tailored to meet the specific requirements of various industries. Whether you operate in energy, agriculture, logistics, or infrastructure management, you will find the data that suits your needs. All variables include 11 quantiles (p0–p100).
Relative humidity
Air temperature (minimum, maximum, average)
Precipitation (intensity, cumulative)
Atmospheric pressure
Wind speed & direction
Solar & UV radiation
Weather uncertainty hits every sector differently. FROGCAST gives you the precision your operations actually need.
Plan around nature, not against it.
Access ultra-accurate weather data to build your own decision triggers (frost risk thresholds, precipitation windows, spray conditions) configured on your own platform.
Generic forecasts trigger unnecessary stoppages or miss real danger windows.
Get site-level data precise enough to power your own operational rules (wind speed at 100m, temperature thresholds for concrete…), whatever your workflow needs.
Route around weather, not through it.
FROGCAST provides the forecast data your systems need to reroute, pre-position inventory, or flag risks before they hit.
Don’t let weather catch your drivers off guard.
Get the route-level forecast data your systems need to anticipate delays, adjust schedules, and surface conditions before drivers encounter them.
Extreme weather events are rare but predictable.
Probabilistic forecast data precise enough to quantify exposure, adjust risk scores, and act before an event occurs.
Know what’s coming before it becomes a crisis.
Get the forecast data your teams need to anticipate risk windows and coordinate responses before conditions deteriorate.
Heat stress, air quality, and extreme cold follow predictable patterns.
Get environmental forecast data your models granular enough to model health impacts and inform preventive strategies.
no credit card required | no commitment
Designed today to anticipate tomorrow, FROGCAST empowers you to make informed decisions by covering all your weather-related needs.
Before
Generic and/or imprecise forecasts, often unsuitable for your operations.
With FROGCAST
Optimal combination of some twenty numerical weather prediction models. Forecasts up to 2.6 times more accurate than individual models from national meteorological agencies.
Before
Frequent discrepancies between forecasts and actual on-the-ground conditions.
With FROGCAST
Data from reputable and verified sources. Solution used at over 14,000 sites worldwide.
Before
No consideration of uncertainty: static forecasts, often inaccurate in critical situations.
With FROGCAST
Integrate probabilistic forecasts: confidence intervals built from 11 quantiles per weather variable help you objectively quantify uncertainty and make more informed decisions.
Before
Laborious API integration and often non-standardized data formats.
With FROGCAST
FROGCAST API requires no development. It follows REST standards, uses the JSON format to encode objects, and relies on HTTPS for security. Integration in just a few clicks.
Before
Approximations due to low granularity of topographic features.
With FROGCAST
Post-processing of altitude-related parameters using 90m topographic data for optimal precision in capturing local variations.
Before
Incomplete and low-resolution forecasts made precise decision-making difficult.
With FROGCAST
Access global forecasts up to 15 days ahead, updated 8 times daily, with high-resolution data down to 1 km using the WRF model.
FROGCAST forecasts are up to 2.6× more accurate than individual national models. This is achieved by aggregating 25+ NWP models and continuously reweighting them based on their real-world performance at each location. So when one model underperforms in a specific region or season, its influence is automatically reduced.
See the benchmark: explore our detailed performance comparison against national models to understand how FROGCAST consistently delivers higher accuracy across regions and seasons.
In most conditions they are close, but they diverge when the distribution of possible outcomes is skewed. A practical example: if there is a small chance of an extreme precipitation event, the mean gets pulled upward by that tail scenario, while the p50 remains anchored to the most likely outcome.
Use the mean when you need to optimize for expected value over many events (energy output forecasting, for instance). Use the p50 when you need the single most representative scenario for a specific day (scheduling an outdoor operation, for example).
For risk management, neither alone is sufficient. The real value of probabilistic forecasts lies in combining both with the broader quantile range: p10–p90 tells you how wide the uncertainty is, while the gap between mean and p50 tells you whether that uncertainty is symmetric or skewed toward an extreme.
A deterministic forecast gives you a single predicted value. A probabilistic forecast gives you the full range of likely outcomes with associated confidence levels.
FROGCAST outputs 11 quantiles per variable, so instead of knowing that tomorrow’s temperature will be 18°C, you know there is a 90% chance it stays between 15°C and 21°C, which is far more useful for operational decision-making.
Yes! Sign up and receive 400 free requests instantly. No credit card required. It’s a great way to explore our service, test queries on the Playground, and see how ultra-accurate weather data can help your research or business.
Get quarterly insights into the energy sector and our latest products.