It is well known that the chaotic nature of the atmosphere makes forecasting its evolution tricky. Using multiple sources of information can help tackle the issue by quantifying and reducing the uncertainty. But, how well does FROGCAST actually perform?
This article evaluates FROGCAST’s predictions against 7 individual Numerical Weather Prediction (NWP) models for 6 atmospheric variables over 3 months.
To learn more about how our forecasts are generated, visit this page. You can also explore all the technical details and features of our predictions here.

Data and evaluation setup
Evaluation period and area
To get relevant and robust results, we assessed FROGCAST from October 1st to December 31st, 2023. The area covers most of Europe (excluding Scandinavia) and part of the Maghreb region. It extends from 30°N to 60°N latitude and from 15°W to 30°E longitude.
Selected weather variables
We selected 6 classical weather variables to get a clear and wide picture of FROGCAST’s performance:
- Temperature at 2 meters (°C)
- Wind speed at 10 meters (m/s)
- Precipitation rate per hour (mm/h)
- Relative humidity at 2 meters (%)
- Mean sea level pressure (hPa)
- Global horizontal irradiation (W/m²)
Evaluation metric
We used the mean absolute error (MAE) computed hourly to measure forecast accuracy.
Gridded reference data: ERA5 Reanalysis
ERA5 ECMWF reanalysis data has been used as gridded pseudo observations to evaluate the different forecasts. This dataset provides information at hourly time step on a 0.25° spatial grid. It combines model data with observations to generate a new best estimate of the state of the atmosphere. More information can be found on the Copernicus Climate Data Store website.
FROGCAST vs NWP models
We compared FROGCAST’s forecasts to 7 NWP models:
- ARPEGE-EU and AROME (Météo-France)
- ICON-EU and ICON-D2 (DWD)
- GFS (NCEP)
- GDPS (CMC)
- IFS-HRES (ECMWF)
Forecasts from each model were taken once daily (0 UTC run) for the first 24 hourly lead times. In order to ensure a fair comparison, all models are reprojected and upscaled to the ERA5 0.25° grid.
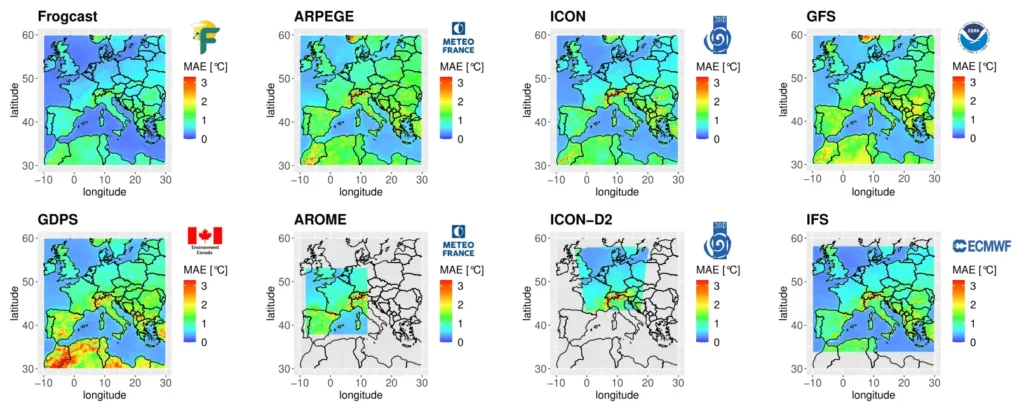
Spatial performances across variables
Spatial performances for 2m temperature are presented on Figure 1 in both absolute value (a) and absolute difference between individual models and FROGCAST (b). For this variable, the best scores are achieved by ICON, ICON-D2 and IFS models. However, for every grid point of the domain, FROGCAST outperforms all individual models and significantly reduces the MAE, especially over continental areas.
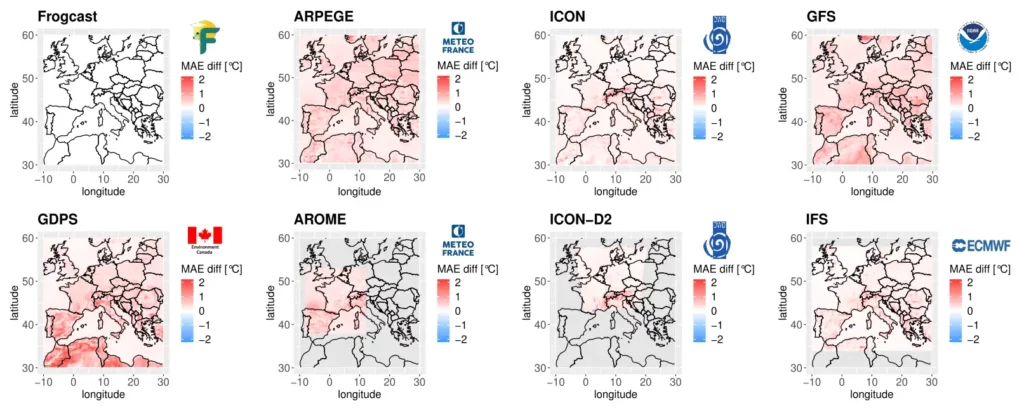
Detailed results for all variables
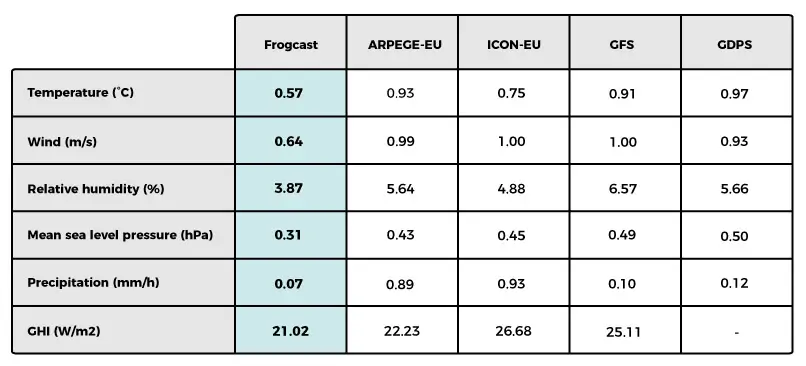
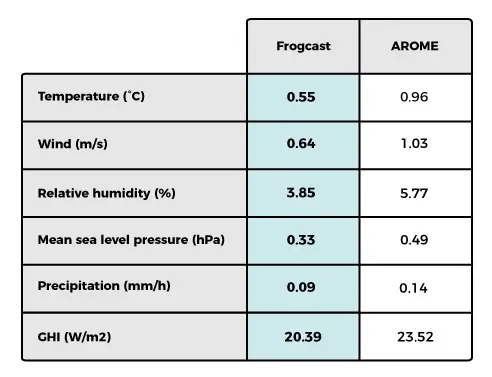
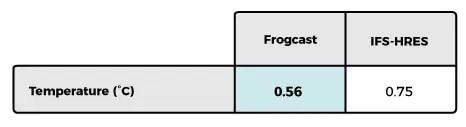
The results regarding all 6 variables are gathered on tables 1 to 4. Scores related to ARPEGE, ICON, GFS and GDPS are averaged over the same full domain and can be compared (Table 1). For the three remaining models, scores correspond to their specific regional domain and must be considered separately.
For all atmospheric parameters, FROGCAST always outperforms every single NWP model. Improvements were notable:
- Temperature at 2m improved by 0.2 to 0.5°C (25% to 40%)
- Wind speed at 10m improved by 0.29 to 0.41 m/s (24% to 39%)
These differences vary a lot spatially with best performances of FROGCAST over continental areas (not shown).
FROGCAST leads the way in accurate weather forecasting
FROGCAST provides high-performance probabilistic weather forecasts for any location in the world and a wide range of atmospheric parameters. This study highlights the relevance of its outputs and that it outperforms every individual NWP model. FROGCAST’s algorithms are optimized for every location and weather variable assuring the best forecasts for any of your specific needs.